
This will be a different piece today. I won’t pontificate on any subject, denigrate any group, or judge any policy. Of course, it wouldn’t be me if I didn’t hit someone, so here’s a joke from Bob Newhart:
I don’t like country music, but I don’t mean to denigrate those who do. And for the people who like country music, denigrate means’ put down’.
Sorry.
Today, I want to write about the state of baseball, specifically professional Major League Baseball. As much as I love the game (and always will), it is a shadow of the game it used to be. To back this up, I’ll use charts and graphs from 1967 and 1970 to the present.
Initially, I wanted to title this “Where Have All the Workhorses Gone.” Specifically, I was thinking about complete games. I checked, and in 1970, there were 852 complete games thrown by pitchers, and (as shown in the chart below) that was the lowest number of the 1970’s. Although it was the lowest number of complete games in the decade, it still accounted for 43.83% of all games played.

Contrast that with 2023, where there were only 35 complete games thrown. As a percent, 2023 matched 2022 as the lowest percent of complete games pitched at 1.48% of all games played. Here’s a chart showing complete games thrown from 1970 through 2023:

You might argue that the rise of free agency and sabermetrics, relief pitchers, and specialists has mitigated the pressure on starting pitchers, allowing teams always to have fresh arms. If that were true, you would expect the number of strikeouts to have increased over the years. And you’re right, although, as I’ll explain, that results from other factors. In fact, the number of strikeouts per game (and innings pitched) has increased since 1970.


As fans will tell you, if there are 27 outs in a game (24 if the winning team is playing at home) and 17 of them are strikeouts, that’s a boring game. And Major League Baseball listens.
Put that aside for a moment, and now consider the batter. In 1970, 27 players hit over .300. That number was steady, with an average of almost 25 players batting over .300 between 1970 and 1993. Note: 1981 was a strike-shortened season.
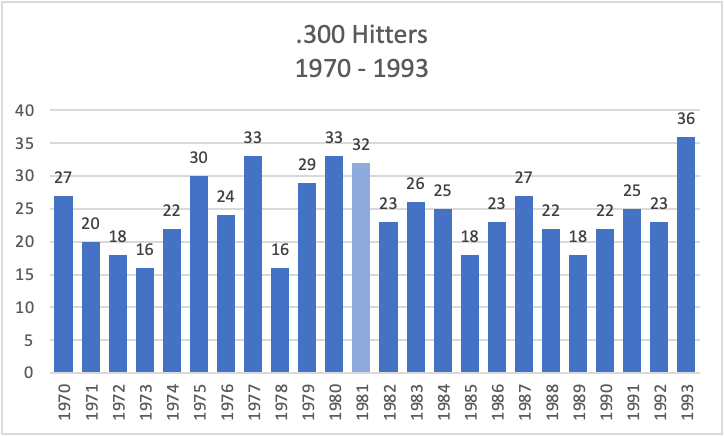
What happened in 1994? 1994 is considered the beginning of the “steroid” era. In 1994, 50 players hit over .300, which remained high throughout the steroid era of 1994 -2004, with an average of about 45 players batting over .300! Note: 1994 was a strike-shortened season.

After that, the wheels fell off. Between 2005 and 2023, the number of .300 hitters has steadily declined. The season that just ended only saw nine batters hit over .300. Nine.

The number is downright anemic if you look at the period from 2018 through 2023. The “high point” in that period was 2020, a season shortened not by a strike but by COVID-19 when teams were fielding players who did not opt to sit out for health reasons and when MLB was a welcome distraction from the pandemic but a shadow of its normal strength.

Okay, so if players aren’t hitting for average, they must be doing something else. Hitting for power! And the statistics bear that out.

The average number of home runs per game has increased every decade since the 1970s. The average number of home runs per game now (2.39 this decade) is higher than the average during the steroid era (2.16).
| Decade | Average Number of HRs per Game |
| 1970’s | 1.49 |
| 1980’s | 1.61 |
| 1990’s | 1.91 |
| 2000’s | 2.15 |
| 2010’s | 2.14 |
| 2020’s | 2.39 |
Of course, the offset to swinging for the fences is a proportional increase in strikeouts. This brings us back to the beginning of this piece. However, instead of looking at strikeouts from the pitcher’s perspective, let us look at them from the batters. Lacing singles and hits to the gaps requires a relatively level swing. Like everything else in baseball, “launch angle” is now tracked. To hit home runs out of the stadium, your swing must be at more of an angle. Simple physics tells me that having the ball on one plane and a bat on the same plane has a better chance of contact than crossing the ball’s plane only at one point due to the increased uppercut swing. This alone should account for the drop in .300 hitters. But it has also resulted in an astronomic increase in seasonal strikeouts. Last year, there were 41,843 strikeouts during the season.
The number of players who struck out 100 times or more has increased substantially since 1970. Remember, 2020 was the pandemic-shortened year, and still, one player struck out more than 100 times!
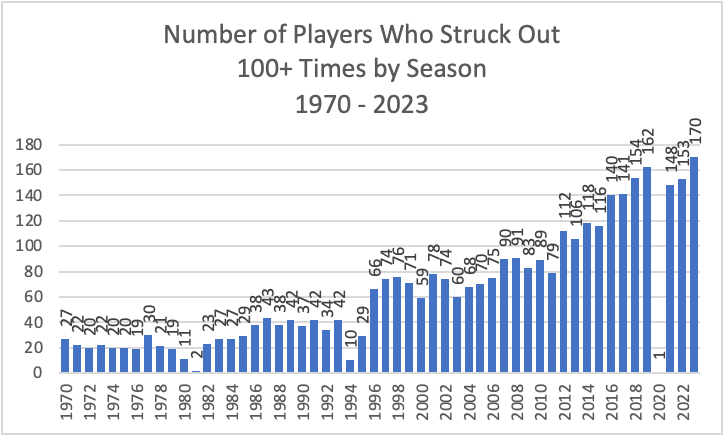
And a new phenomenon has emerged. There are now everyday players who strike out more than 200 times a year!

There are other factors at play here. I can hear my pitcher brother talking about how the ball has changed over time, how the rules have changed, how umpires have changed. And I agree. I am identifying concerns as a lifelong fan of the game and how it has changed.
In 1967, the minimum salary in MLB was $6,000. The real median personal income in America was $4,527. Baseball players earned a multiple of 1.33 times more than the average American. The average MLB salary was $19,000, a multiple of 4.20 the average American. In 2020, the minimum MLB salary was $563,000, and the average MLB salary was $4,430,000. The median personal income in America was $62,797. The multiples for minimum and average to the average American are now 8.97 and 70.54, respectively. Put another way, the Real median personal income in America has gone up 1,287% from 1967 to 2020 ($4,527 to $62,797), whereas the minimum MLB salary has gone up 9,292% from 1967 to 2020 ($6,000 to $563,000). The average MLB salary has gone up 23,216% in the same period ($19,000 to $4,430,000).
I like home runs; I don’t like strikeouts. I love baseball, and I always will.
These are my notes. Maybe you love the modern game. I welcome any comments you may have.
